The current resource bubble will no doubt have many people salivating, as usual, and whilst my charts are all calendar year, I thought I would have a look at the last 3 financial years just to bring myself up to date.
Ever grateful to Angus Gluskie, CEO of Whitefield, for his assistance; the chart below takes 2019 as the starting point and looks at the dividend changes for 2020, 2021 and 2022 for Industrials, Resources and the All Ordinaries.
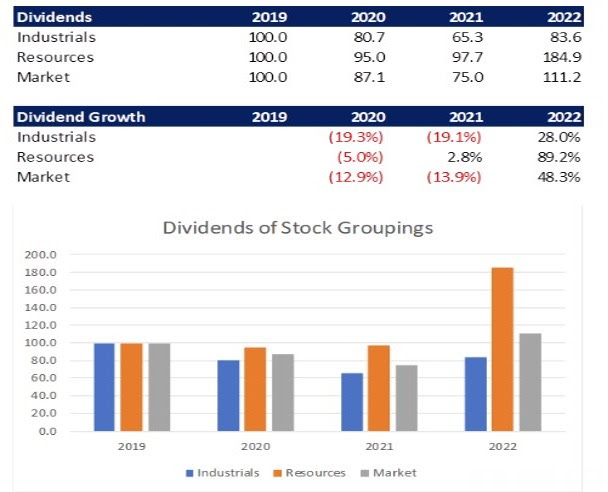
Clearly, the impact of Covid effected our industrial companies as dividends were suspended and reduced during this very unsettling period and one must acknowledge the spectacular jump in resource payouts.
Resource bubbles are a fact of life and jolly fun for speculators, but we must not lose sight of the longer-term impact. Index funds will have been selling industrials to buy resource stocks and when the bubble bursts they will be selling resources to buy back the industrials. I wait to see the impact on distributions from these index funds post the change.
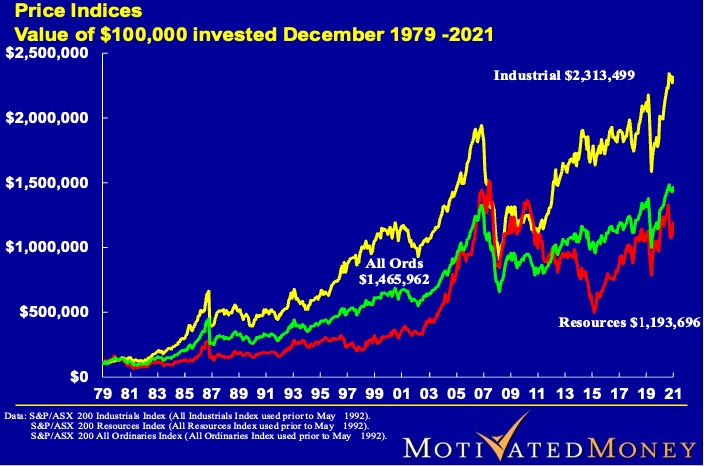
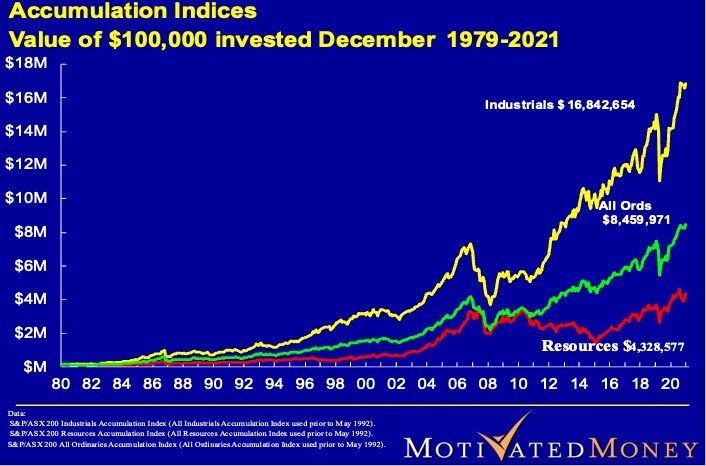
The charts below covers the last 41 years of performance for the price and accumulation indices. They say a picture is worth a thousand words! Digging stuff out of the ground is all well and good but we must remember that the real value add comes from the manufacturing, intellectual and technological inputs; not labour.